Review : Last book of February. Learnt to make quality choices in the stock market.
Notes / Lessons / Quotes :
To realise profits from investing in stocks, you must make three correct decisions: ① what to buy ② when to buy ③ when to sell. Not all of your decisions will turn out to be correct, but they can be intelligent.
Any pattern of action repeated continuously will eventually become habit. Therefore, practice does not make perfect; practice only makes it habitual. Only perfect practice makes perfect.
Trading stocks and running a business are virtually identical. To be successful, you must trade just as if you were running a business. As an investor, your merchandise is stocks. Your objective is to buy shares that are in strong demand and sell them at a higher price. How much of a profit margin you make will depend a lot on the type of business (portfolio) you are running.
If you treat trading like a business, it will pay you like a business. If you treat trading like a hobby, it will pay you like a hobby, and hobbies don’t pay; they cost you.
SPECIFIC ENTRY POINT ANALYSIS (SEPA)
5 key elements
• Trend
• Fundamentals
• Catalyst
• Entry Points
• Exit Points
VALUATION
How high or low the price is relative to where it was previously is NOT the determining factor in whether a stock will go higher still.
Value doesn’t move stock prices; people do by placing buy orders. Value is only part of the equation. Ultimately, you need demand. Only the perception of value can influence people to buy, not the mere reading of a valuation metric.
Concluding the stock is overvalued because it sells for 65 times earnings is like saying that a van Gogh painting selling at $49m at auction is overvalued because the paint and canvas cost only 40 bucks.
P/E ratio
• No magic P/E ratio
• Seek out companies with the greatest potential for earnings growth
• Avoid stock with super lower P/E ratio
• Think of it as a barometer that measures the level of expectation
• It doesn’t have much predictive value for finding super-performance stocks
TREND
Stages of a stock cycle
• Stage 1 : Neglect phase – Consolidation
• Stage 2 : Advancing phase – Accumulation
• Stage 3 : Topping phase – Distribution
• Stage 4 : Declining phase – Capitulation
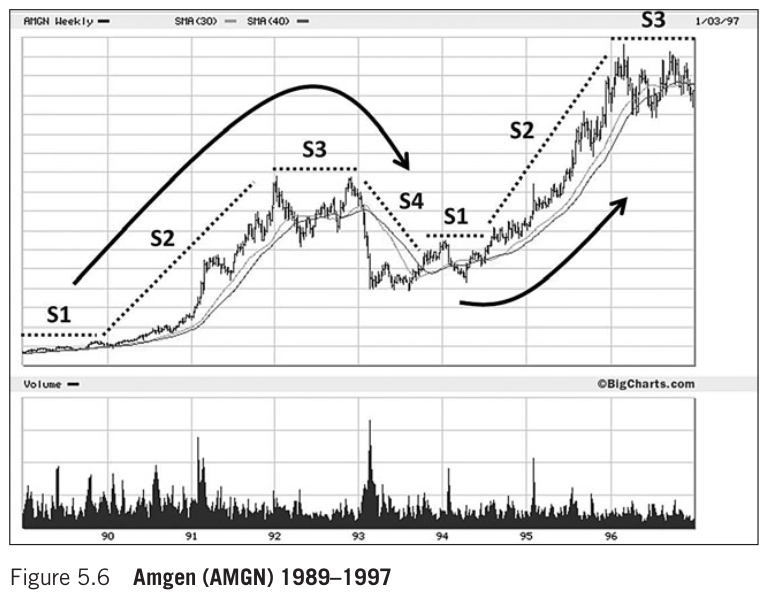
You should avoid buying during stage 1 no matter how tempting it may be; even if the company’s fundamentals look appealing, wait and buy only in stage 2.
My goal is not to buy at the lowest or cheapest price but at the “right” price, just as the stock is ready to move significantly higher.
Trend Template to pinpoint Stage 2
• Stock price > 50-day MA > 150-day MA > 200-day MA
• 200-day MA line is trending up for at least 1 month (preferably 4-5 months min in most cases)
• Stock price is at least 30% above its 52w low
• Stock price is within at least 25% of its 52w high (the closer to a new high the better)
• Relative strength ranking is no less than 70, and preferably in the 80s or 90s
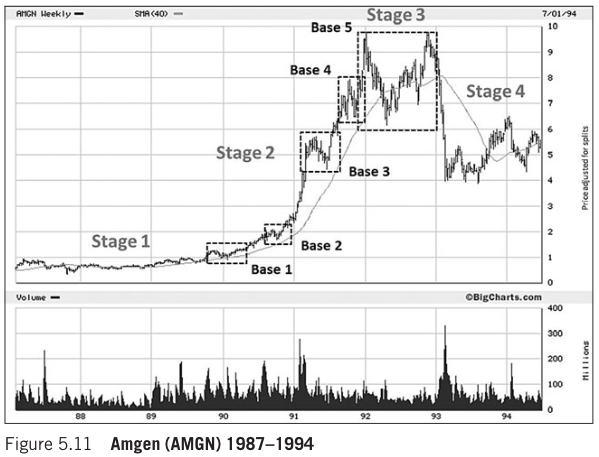
📈 The Base Count
• The descent generally occurs after 3 to 5 bases have formed in a stage 2 uptrend
• Base 1 and 2 is the best time to get in
• Base counting will not tell you if a stock has topped or is about to move substantially higher
• It provides a great way to gain perspective on where you are within the stage 2 advance
You want to get on board when institutional money is pouring into a stock and lifting it significantly higher. To do that, you need confirmation that this inflow is starting to happen before you invest.
The goal is not to buy at the cheapest price but to sell your stock for significantly more than the price you paid in the shortest period. That’s how superperformance is achieved.
📉 Material change in price behaviour
• Before it becomes apparent that the fundamentals have changed, a major break in the stock price often will occur on overwhelming volume
• There’s a reason for the adverse price move; you just don’t know yet
• Don’t listen to the company or the media; listen to the stock
• Don’t think a big break in the stock is a buying opportunity
Groups that have produced the largest number of superperformance stocks
• Consumer / retail
• Tech, computer, software and related
• Drugs, medical and biotech
• Leisure / entertainment
FUNDAMENTALS
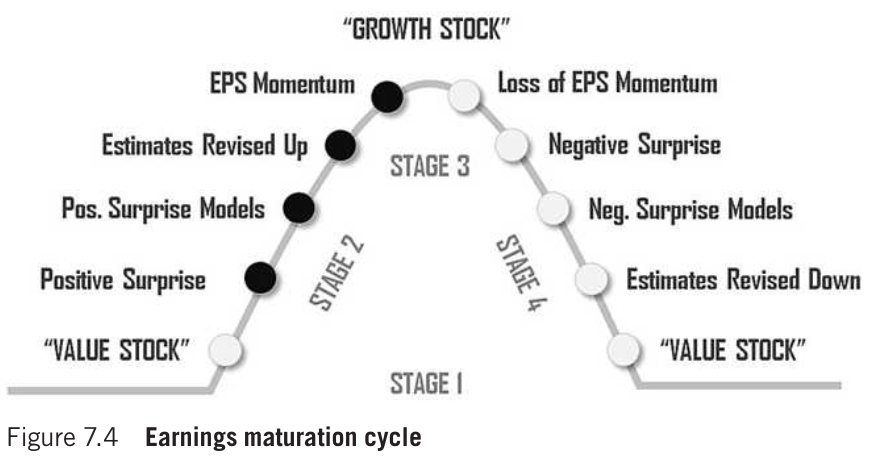
Three basic questions every investors should ask when it comes to earnings: ① How much? ② How long? ③ How certain? Profitability, sustainability, and visibility represent the most influential factors that move stock prices.
Stocks move for two basic reasons: anticipation and surprise. Every price movement is rooted in one of these two elements: ① anticipation of news, an event, an important business change, or ② reaction to a surprise, whether positive or negative.
Institutions like to see the following
• Earnings surprises
• Accelerating EPS and revenues
• Expanding margins
• EPS breakout
• Strong annual EPS change
• Signs that acceleration will continue
TECHNICAL ANALYSIS
Chart patterns are not the causes; they’re the effect. The supply and demand picture does not dictate to the market; human behaviour does, and human behaviour hasn’t changed and isn’t likely to change much in the future. Thus, chart patterns remain powerful tools in timing trade entries and exits.
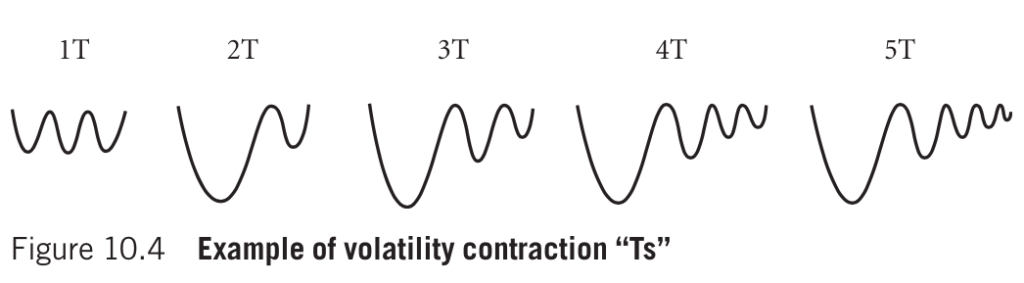
A common characteristics of virtually all constructive price structures (those under accumulation) is a contraction of volatility accompanied by specific areas in the base structure where volume contracts significantly. Minervini uses the Volatility Contraction Pattern (VCP) concept to illustrate this.
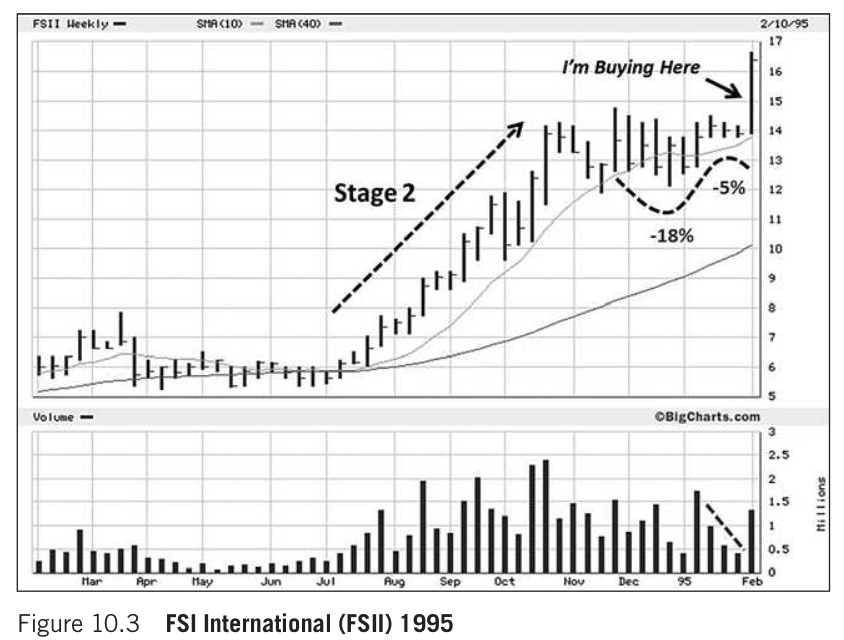
Volatility Contraction Pattern (VCP)
• It’s part of the supply and demand setup
• Its main role is to establish a precise entry point at the line of least resistance
• Width : Most VCP setups will be formed by two to four contractions, tho there can be as many as six
• Depth : Each successive contraction contained to about half (plus or minus a reasonable amount) of the previous pullback or contraction (see fig 10.3 below)
• Tightness in price should be accompanied by a significant decrease in trading volume (tight and light)
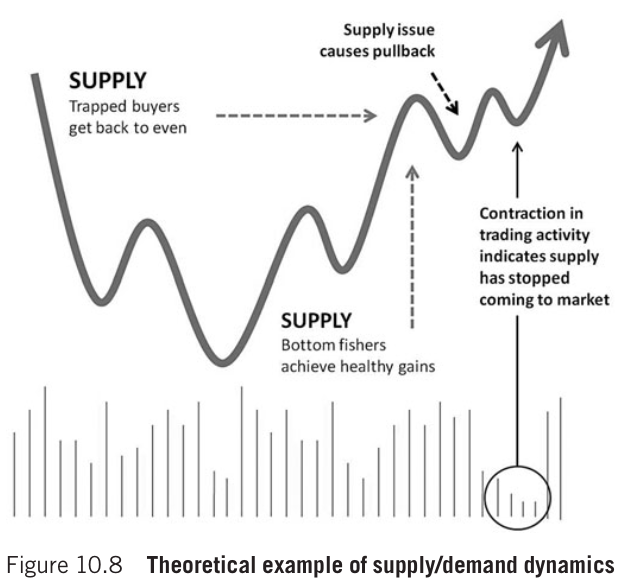
Overhead Supply
• Trapped buyers who bought around the stock’s previous high point and are now sitting with a loss. This is what creates overhead supply: investors who want out around their breakeven point → Supply (Sell Pressure)
• Bottom fishers take profit near its old high → Supply (Sell Pressure)
A Primary Base (a minimum trading history)
• The biggest part of a company’s growth usually occurs in the first 5 to 10 years after the company issues common stock and goes public
• You must wait for the market to confirm your fundamental belief
• Your opinion about a company is worthless unless it’s verified by the price action of the stock
• Insist that the stock put in a base of at least 3 to 5 weeks and more correct more than 25% to 35% to be reliable
RISK MANAGEMENT
Loss
• Losses are a function of expected gain
• You have no control over how much a stock goes up, but you can control the amount you lose on each trade
• Shouldn’t allow any stock to fall more than 10% before selling
Pacing
• Learn to wait patiently until the wind is at your back
Scaling in, not averaging down
• Professionals scale into positions whereas amateurs average down
‣ e.g. To risk 5% of their capital on a trade, scale in with 2% on the first buy, 2% on the second, 1% on the third
• Try to buy or add to a position in the direction of the trade only after it has shown a profit
• Never trust the first price unless the position shows you a profit
Diversification
• It does not protect you from loses
• Typically 4-6 stocks in a portfolio, 10-12 stocks for large portfolios
Books mentioned :
How to Trade in Stock – Jesse Livermore
Superperformance Stocks – Richard Love
The Relative Strength Concept of Common Stock Price Forecasting – Robert A. Levy
Stock Market Blueprints – Edward S. Jensen
Secrets for Profiting in Bull and Bear Market – Stan Weinstein
How Charts Can Help You in the Stock Market – William L. Jiler